Building Daily Hot New Timeline: Crafting a Trending Data Visualization Tool
Project Genesis
Unveiling the Daily Hot New Timeline: A Journey of Inspiration and Innovation
From Idea to Implementation
1. Initial Research and Planning
- Data Sources: Identifying reliable APIs and datasets, such as those from Douyin and trending topics, to gather relevant information for the project.
- Content Generation: Exploring tools for converting academic papers into various formats (e.g., podcasts, videos) and extracting key insights.
- Translation and Summarization: Investigating libraries and frameworks that could assist in translating content and summarizing papers effectively.
2. Technical Decisions and Their Rationale
-
Choice of Frameworks: The decision to use frameworks like MkDocs for documentation and various GitHub repositories for specific functionalities (e.g., paper-to-video conversion) was based on their popularity and community support. This ensured that the project could leverage existing solutions rather than building everything from scratch.
-
Data Processing Tools: The use of Python libraries for PDF parsing and data extraction was chosen for their robustness and ease of integration. For instance, the
grobidtool was selected for its ability to extract metadata from academic papers efficiently. -
Content Generation: The integration of GPT-based models (e.g., GPT-2) for generating summaries and translations was a strategic choice, as these models have shown impressive results in natural language processing tasks. This decision aimed to enhance the quality of the generated content.
3. Alternative Approaches Considered
-
Manual Data Collection: Initially, there was a consideration to manually collect data from academic papers and related sources. However, this approach was quickly deemed impractical due to the volume of data and the need for automation.
-
Different Content Formats: While the focus was on generating podcasts and videos, other formats such as infographics and interactive web applications were considered. Ultimately, the decision to prioritize podcasts and videos was based on their growing popularity and accessibility.
-
Other NLP Models: Although GPT-based models were chosen for content generation, other models like BERT and T5 were also evaluated. However, the decision favored GPT due to its generative capabilities, which aligned better with the project’s goals.
4. Key Insights That Shaped the Project
-
User Needs: Understanding the needs of the target audience was crucial. Feedback from potential users highlighted the demand for easily digestible content derived from complex academic papers, which shaped the project’s focus on summarization and translation.
-
Integration of Tools: The realization that integrating multiple tools and APIs could create a more robust system led to a modular approach in development. This allowed for flexibility and the ability to swap out components as needed.
-
Iterative Development: Emphasizing an iterative development process allowed for continuous improvement based on testing and user feedback. This approach helped refine features and enhance the overall user experience.
Conclusion
Under the Hood
1. Architecture Decisions
-
Data Sources: The project aggregates data from various repositories, such as Douyin hot trends, daily hot APIs, and trending topics. This suggests a decision to utilize existing resources rather than building everything from scratch, promoting efficiency and leveraging community contributions.
-
Data Processing: The README mentions generating timelines and extracting keywords from papers, indicating a focus on data transformation and analysis. This could involve using ETL (Extract, Transform, Load) processes to handle data from different formats and sources.
2. Key Technologies Used
-
Markdown and MkDocs: For documentation and possibly for generating static sites, which suggests a focus on user-friendly presentation of information.
-
Python: The presence of Python scripts (e.g., for PDF parsing and translation) indicates that Python is a primary language for data processing tasks.
-
APIs: The use of various APIs (e.g., for video generation from papers) suggests a reliance on RESTful services for data retrieval and interaction.
-
Machine Learning: The mention of GPT models (e.g.,
gpt_academic,ChatPaper) indicates the use of natural language processing (NLP) techniques for tasks like summarization, translation, and content generation.
3. Interesting Implementation Details
-
Data Retrieval: The project seems to implement a mechanism to scrape or retrieve data from various sources, including papers and trending topics. This could involve web scraping techniques or API calls to gather the necessary data.
-
Keyword Extraction: The README mentions modifying papers to extract keywords, which could involve using NLP libraries like NLTK or spaCy to analyze text and identify significant terms.
-
Translation and Image Generation: The project includes functionality for translating content and generating images, possibly using libraries like PIL (Python Imaging Library) for image processing and translation APIs for language conversion.
-
Scheduled Tasks: The mention of modifying crawling tasks for scheduled execution suggests the use of task schedulers like Celery or cron jobs to automate data collection.
4. Technical Challenges Overcome
-
Data Integration: One of the primary challenges in such a project is integrating data from diverse sources with varying formats and structures. The architecture must handle inconsistencies and ensure data quality.
-
Scalability: As the project grows and more data sources are added, ensuring that the system can scale to handle increased load without performance degradation is crucial.
-
NLP Challenges: Implementing effective NLP techniques for tasks like summarization and translation can be complex, requiring fine-tuning of models and handling edge cases in language processing.
-
User Experience: Creating a user-friendly interface for accessing and interacting with the data is essential. This involves not only technical implementation but also design considerations to ensure usability.
Code Concepts
import requests

def fetch_data(api_url):
    response = requests.get(api_url)
    if response.status_code == 200:
        return response.json()
    else:
        raise Exception("Failed to fetch data from API")

data = fetch_data("https://api.example.com/trending")import spacy
def extract_keywords(text):
nlp = spacy.load("en_core_web_sm")
doc = nlp(text)
keywords = [token.text for token in doc if token.is_alpha and not token.is_stop]
return keywords
keywords = extract_keywords("This is a sample text for keyword extraction.")from celery import Celery
app = Celery('tasks', broker='redis://localhost:6379/0')
@app.task
def crawl_data():
# Logic to crawl data
pass
# Schedule the task
crawl_data.apply_async(countdown=60) # Run after 60 secondsLessons from the Trenches
Key Technical Lessons Learned
-
Data Integration: Successfully integrating multiple data sources (e.g., Douyin, DailyHotApi, and trending-in-one) is crucial for creating a comprehensive timeline. Understanding the APIs and data formats of these sources is essential for effective data retrieval and processing.
-
Automation of Data Retrieval: Implementing scheduled tasks for data scraping and retrieval can streamline the process of keeping datasets up-to-date. Tools like cron jobs or task schedulers can be beneficial.
-
Content Transformation: Converting PDFs to Markdown and extracting keywords from papers requires robust parsing techniques. Utilizing libraries like
pdfminerorPyMuPDFcan enhance the accuracy of data extraction. -
Multimedia Content Generation: The ability to convert papers into various formats (videos, podcasts) demonstrates the importance of versatility in content presentation. Leveraging tools like
gpt_academicfor summarization and translation can enhance accessibility. -
User Interface Design: Choosing the right style and framework (e.g., MkDocs for documentation) can significantly impact user experience. A clean, intuitive design helps users navigate and engage with the content effectively.
What Worked Well
-
Collaboration with Open Source Projects: Leveraging existing repositories (like
ChatPaperandPaperCrawler) allowed for rapid development and reduced redundancy in coding efforts. -
Community Engagement: Engaging with the community through platforms like GitHub fosters collaboration and knowledge sharing, leading to improved project outcomes.
-
Iterative Development: Adopting an iterative approach to development allowed for continuous improvement based on user feedback and testing.
What You’d Do Differently
-
Enhanced Documentation: While the README provides a good overview, more detailed documentation on setup, usage, and troubleshooting would benefit new users and contributors.
-
Testing and Validation: Implementing a more rigorous testing framework for data retrieval and processing would help catch errors early and ensure data integrity.
-
Scalability Considerations: Planning for scalability from the outset, especially in data storage and processing, would prevent bottlenecks as the project grows.
Advice for Others
-
Start Small: Focus on a core feature set before expanding. This allows for manageable development and testing phases.
-
Utilize Existing Tools: Don’t reinvent the wheel. Use existing libraries and frameworks to save time and effort.
-
Engage with Users: Regularly solicit feedback from users to understand their needs and pain points. This can guide future development and feature prioritization.
-
Stay Updated: Keep abreast of new technologies and methodologies in data processing and content generation to continuously improve your project.
-
Document Everything: Maintain thorough documentation throughout the project lifecycle. This not only aids in onboarding new contributors but also serves as a reference for future development.
What’s Next?
Conclusion for Daily Hot New Timeline
Project Development Analytics
timeline gant
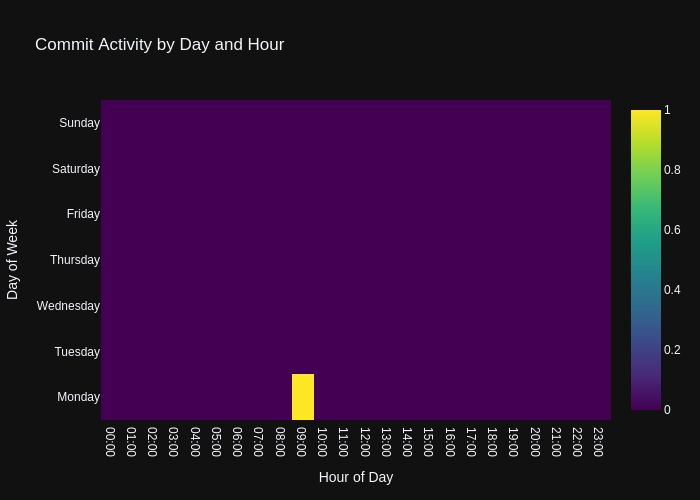
Commit Activity Heatmap
Contributor Network

Commit Activity Patterns
Code Frequency
- Repository URL: https://github.com/wanghaisheng/daily-hot-new-timeline
- Stars: 0
- Forks: 0
编辑整理: Heisenberg 更新日期:2024 年 12 月 30 日