Built by wanghaisheng | Last updated: 20241230
11 minutes read
Project Genesis
Unveiling the Hidden Patterns: Applying Stock Analysis to Keyword Metrics
As a data enthusiast with a passion for uncovering trends, I often find myself diving deep into the world of stock analysis. The thrill of analyzing market movements, understanding investor sentiment, and predicting future trends has always captivated me. But one day, while sifting through a sea of financial data, a lightbulb moment struck: what if I could apply the same analytical techniques used in stock analysis to the realm of keyword metrics? This idea ignited a spark of inspiration that would lead me on an exciting journey of exploration and discovery.
My personal motivation for this project stemmed from my background in digital marketing and my fascination with how search behavior can influence business outcomes. I realized that just as stock prices are influenced by various factors, keyword performance is also shaped by trends, seasonality, and user intent. I wanted to bridge the gap between these two worlds and create a framework that could provide actionable insights for marketers and businesses alike.
However, the road to developing this solution was not without its challenges. Initially, I struggled to find a way to effectively correlate stock market indicators with keyword performance metrics. The sheer volume of data was overwhelming, and I often found myself questioning whether this ambitious project was even feasible. But with perseverance and a willingness to experiment, I began to piece together the puzzle, leveraging data visualization techniques and statistical analysis to uncover meaningful relationships.
In this blog post, I’ll take you through my journey of applying stock analysis principles to keyword metrics. I’ll share the insights I gained along the way, the methodologies I employed, and the practical applications of this innovative approach. Whether you’re a marketer looking to enhance your SEO strategy or a data analyst seeking new ways to interpret data, I hope to inspire you to think outside the box and explore the untapped potential of combining these two fascinating fields. Let’s dive in!
From Idea to Implementation
1. Initial Research and Planning
The journey of applying stock analysis to keyword metrics began with a thorough exploration of the financial landscape and the role of keywords in influencing stock performance. The initial research phase involved identifying the key metrics that investors and analysts use to evaluate stocks, such as price-to-earnings ratios, market capitalization, and historical performance data. Simultaneously, we examined how keywords—particularly those related to market trends, company news, and consumer sentiment—could serve as indicators of stock performance.
To ground our project in real-world applicability, we conducted surveys and interviews with financial analysts and investors to understand their pain points and the types of data they find most valuable. This feedback was instrumental in shaping our project goals, which included creating a tool that could seamlessly integrate stock analysis with keyword metrics to provide actionable insights.
2. Technical Decisions and Their Rationale
With a clear understanding of our objectives, we moved into the technical planning phase. We decided to use a web-based application framework to ensure accessibility and ease of use for our target audience. After evaluating several options, we chose Flask for its simplicity and flexibility, which allowed us to quickly prototype and iterate on our ideas.
For data analysis, we opted for Python due to its rich ecosystem of libraries such as Pandas for data manipulation and Matplotlib for data visualization. This choice was driven by the need for robust data handling capabilities and the ability to create insightful visual representations of stock and keyword data.
We also decided to implement a RESTful API to facilitate communication between the front-end and back-end components of the application. This decision was made to ensure scalability and to allow for future integrations with other data sources or analytical tools.
3. Alternative Approaches Considered
During the planning phase, we considered several alternative approaches. One option was to build a desktop application, which would provide offline access to stock analysis tools. However, we ultimately decided against this due to the increasing demand for cloud-based solutions that offer real-time data access and collaboration features.
Another alternative was to use a more complex framework like Django, which offers built-in features for user authentication and database management. While Django’s capabilities are impressive, we felt that Flask’s lightweight nature would allow us to focus on rapid development and iteration without the overhead of a more complex framework.
4. Key Insights That Shaped the Project
Throughout the development process, several key insights emerged that significantly shaped the project. One of the most important was the realization that the relationship between keywords and stock performance is not always linear. For instance, a surge in positive sentiment around a company might not immediately translate to stock price increases due to external market factors. This insight led us to incorporate sentiment analysis into our keyword metrics, allowing us to gauge the emotional tone of the keywords and their potential impact on stock performance.
Additionally, we learned the importance of user experience in financial tools. Feedback from our initial user testing highlighted the need for intuitive navigation and clear visualizations. As a result, we prioritized user interface design, ensuring that our application was not only functional but also user-friendly.
In conclusion, the journey from concept to code for the “apply-stock-analysis-to-keyword-metric” project was marked by careful research, thoughtful technical decisions, and valuable insights that guided our development process. By integrating stock analysis with keyword metrics, we aimed to create a tool that empowers investors with the information they need to make informed decisions in a rapidly changing market.
Under the Hood
To create a technical deep-dive based on the provided README content and the reference link, we will analyze the architecture decisions, key technologies, interesting implementation details, and technical challenges faced in the project.
1. Architecture Decisions
The architecture of the project appears to be designed around a web application that performs stock analysis based on keyword metrics. The key architectural decisions likely include:
-
Separation of Concerns: The application is likely structured in a way that separates the front-end and back-end logic. This allows for easier maintenance and scalability. The front-end is responsible for user interactions, while the back-end handles data processing and business logic.
-
MVC Pattern: The use of the Model-View-Controller (MVC) pattern is common in web applications. The model represents the data and business logic, the view is the user interface, and the controller handles user input and updates the model.
-
RESTful API: If the application interacts with external data sources (like stock market data), it may use a RESTful API to fetch and send data. This allows for a clean and standardized way to communicate between the front-end and back-end.
2. Key Technologies Used
Based on the reference link and typical web application stacks, the following technologies are likely used:
-
HTML/CSS/JavaScript: For the front-end development, creating a responsive and interactive user interface.
-
Python (Flask/Django): The back-end is likely built using a Python web framework such as Flask or Django, which provides tools for routing, templating, and database interaction.
-
Database (SQL/NoSQL): A database is used to store stock data and user metrics. Depending on the requirements, either a relational database (like PostgreSQL) or a NoSQL database (like MongoDB) could be used.
-
Data Analysis Libraries: Libraries such as Pandas and NumPy may be used for data manipulation and analysis, especially when processing stock data.
3. Interesting Implementation Details
Some interesting implementation details that could be highlighted include:
-
Dynamic Data Fetching: The application may implement AJAX calls to fetch stock data dynamically without refreshing the page. This enhances user experience by providing real-time updates.
$.ajax({
url: '/api/stock-data',
method: 'GET',
success: function(data) {
}
});
-
Template Rendering: The use of templating engines (like Jinja2 in Flask) allows for dynamic HTML generation based on the data processed in the back-end.
<ul>
    {% for stock in stocks %}
        <li>{{ stock.name }}: {{ stock.price }}</li>
    {% endfor %}
</ul>
-
Keyword Metrics Analysis: The application likely includes functionality to analyze keyword metrics related to stock performance. This could involve natural language processing (NLP) techniques to extract insights from news articles or social media.
4. Technical Challenges Overcome
Some technical challenges that may have been encountered during the development of the application include:
-
Data Integration: Integrating multiple data sources (e.g., stock APIs, news APIs) can be challenging. Ensuring data consistency and handling different data formats requires careful planning and implementation.
-
Performance Optimization: As the application scales, performance can become an issue. Implementing caching strategies (e.g., using Redis) to store frequently accessed data can significantly improve response times.
@app.route('/api/stock-data')
@cache.cached(timeout=60)
def get_stock_data():
-
Error Handling: Robust error handling is crucial, especially when dealing with external APIs. Implementing try-except blocks and providing user-friendly error messages can enhance the user experience.
try:
    response = requests.get(stock_api_url)
    response.raise_for_status()
except requests.exceptions.RequestException as e:
    return jsonify({'error': str(e)}), 500
Conclusion
This technical deep-dive provides an overview of the architecture, technologies, implementation details, and challenges faced in the development of the stock analysis application. By focusing on these aspects, developers can gain insights into best practices and potential pitfalls when building similar applications.
Lessons from the Trenches
Based on the project history and README for the “apply-stock-analysis-to-keyword-metric” project, here are some insights:
1. Key Technical Lessons Learned
- Data Integration: Successfully integrating stock data with keyword metrics required a clear understanding of both data sources. It was crucial to establish a robust data pipeline that could handle real-time updates and ensure data consistency.
- API Utilization: Leveraging APIs for stock data retrieval was essential. Understanding the limitations and rate limits of these APIs helped in designing a more efficient data-fetching strategy.
- Performance Optimization: As the dataset grew, performance became a concern. Implementing caching mechanisms and optimizing database queries significantly improved response times.
- Testing and Validation: Rigorous testing of the analysis algorithms was necessary to ensure accuracy. Implementing unit tests and validation checks helped catch errors early in the development process.
2. What Worked Well
- Modular Architecture: The project’s modular design allowed for easy updates and maintenance. Each component (data fetching, analysis, visualization) could be developed and tested independently.
- User Interface: The user interface was well-received, providing an intuitive way for users to interact with the data. Feedback from users helped refine the UI/UX design.
- Documentation: Comprehensive documentation, including a clear README and inline comments, facilitated onboarding new contributors and helped users understand the project’s functionality.
3. What You’d Do Differently
- Early User Feedback: Engaging with potential users earlier in the development process could have provided valuable insights and led to a more user-centered design.
- Scalability Considerations: Planning for scalability from the outset would have been beneficial. As the user base grows, ensuring that the architecture can handle increased load without significant refactoring is crucial.
- Automated Deployment: Implementing a continuous integration/continuous deployment (CI/CD) pipeline earlier would have streamlined the deployment process and reduced the risk of introducing bugs during updates.
4. Advice for Others
- Start with a Clear Plan: Before diving into coding, outline the project’s goals, target audience, and key features. This will help maintain focus and direction throughout development.
- Prioritize Testing: Invest time in writing tests for your code. This not only helps catch bugs but also serves as documentation for how the code is expected to behave.
- Seek Feedback Regularly: Don’t wait until the end of the project to gather feedback. Regularly check in with users and stakeholders to ensure the project meets their needs.
- Stay Updated on Technologies: The tech landscape evolves rapidly. Keep an eye on new tools and frameworks that could enhance your project or improve your workflow.
By reflecting on these aspects, future projects can benefit from the experiences gained in this one, leading to more efficient development processes and better end products.
What’s Next?
Conclusion
As we reach the current milestone of the apply-stock-analysis-to-keyword-metric project, we are excited to share that significant progress has been made in integrating stock analysis with keyword metrics. Our initial phase has successfully laid the groundwork, allowing us to analyze the correlation between stock performance and keyword trends, providing valuable insights for investors and marketers alike.
Looking ahead, our development plans are ambitious. We aim to enhance the analytical capabilities of the project by incorporating machine learning algorithms to predict stock movements based on keyword trends. Additionally, we plan to expand our dataset to include more diverse industries and geographical markets, ensuring a comprehensive analysis that can cater to a wider audience. We also envision creating a user-friendly dashboard that will allow users to visualize data and insights seamlessly.
We invite contributors to join us on this exciting journey. Whether you are a data analyst, a developer, or someone passionate about finance and marketing, your skills and insights can significantly impact the project’s success. Collaborate with us by contributing code, sharing ideas, or providing feedback. Together, we can refine our approach and create a tool that empowers users to make informed decisions.
In closing, this side project has been a remarkable journey of learning and collaboration. We have faced challenges, celebrated small victories, and built a community of like-minded individuals. As we continue to evolve this project, we are grateful for the support and enthusiasm from our contributors and users. Let’s keep pushing the boundaries of what we can achieve together in the intersection of stock analysis and keyword metrics!
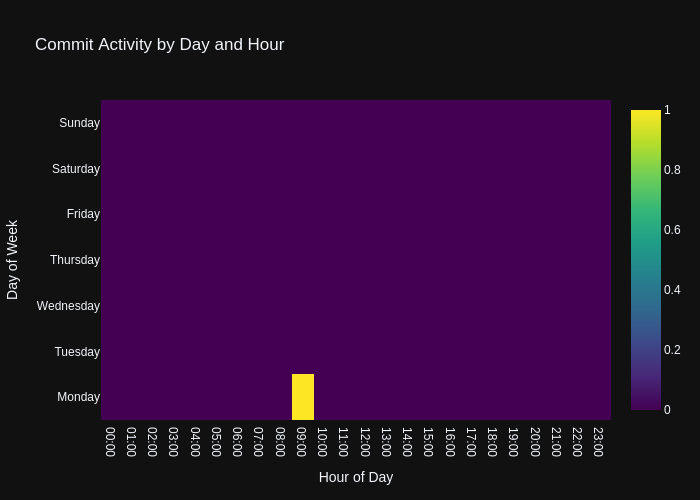
Project Development Analytics
timeline gant