Building DailyHotApi: A Developer's Journey to Hot Data Aggregation
Heisenberg
2024 年 12 月 30 日
🔥 今日热榜 API,一个聚合热门数据的 API 接口,支持 RSS 模式 及 Vercel 部署 | 前端页面:https://github.com/imsyy/DailyHot
Built by wanghaisheng | Last updated: 20241230
1 minute 33 seconds read
Project Genesis
Unveiling DailyHotApi: Your Gateway to Trending Data
As a tech enthusiast and a data lover, I’ve always been fascinated by the pulse of the internet—what captures attention, what sparks conversations, and what trends are shaping our world. This curiosity led me to the creation of DailyHotApi, a project born from the desire to aggregate and present the hottest data in a user-friendly way. Imagine having a tool that not only keeps you updated on the latest trends but also empowers you to harness that information for your own projects. That’s the vision I had when I embarked on this journey.
My personal motivation stemmed from countless hours spent sifting through various platforms, trying to piece together what was trending across different domains. I realized there had to be a more efficient way to access this information. The idea of creating an API that could serve as a one-stop shop for trending data was not just appealing; it felt necessary. However, like any ambitious project, the road to realization was fraught with challenges. From figuring out how to effectively scrape and aggregate data from multiple sources to ensuring the API was robust and scalable, each hurdle tested my resolve.
But with every challenge came a solution. I dove deep into the world of APIs, data aggregation, and cloud technologies, ultimately crafting DailyHotApi to be a seamless interface that delivers trending data at your fingertips. Whether you’re a developer looking to integrate trending topics into your application or simply a curious mind wanting to stay ahead of the curve, DailyHotApi is designed with you in mind.
Join me as I explore the features, benefits, and the journey behind DailyHotApi, and discover how this tool can transform the way you engage with trending data!
From Idea to Implementation
Under the Hood
Lessons from the Trenches
What’s Next?
Project Development Analytics
timeline gant
Commit timelinegant
Commit Activity Heatmap
This heatmap shows the distribution of commits over the past year:
Commit Heatmap
Contributor Network
This network diagram shows how different contributors interact:

Contributor Network
Commit Activity Patterns
This chart shows when commits typically happen:
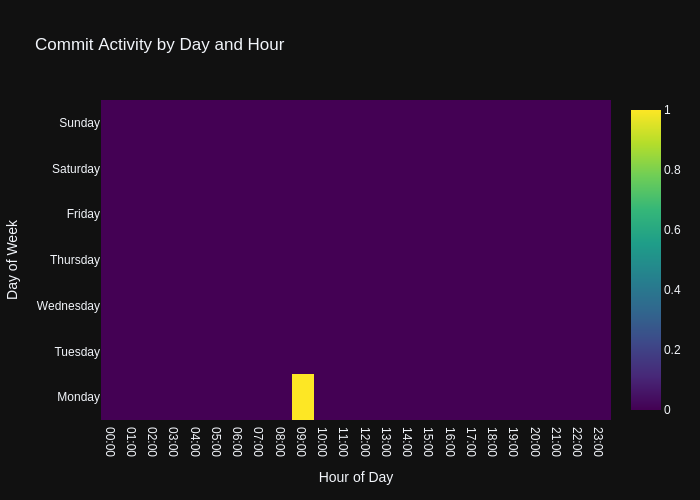
Commit Activity
Code Frequency
This chart shows the frequency of code changes over time:
Code Frequency
- Repository URL: https://github.com/wanghaisheng/DailyHotApi
- Stars: 0
- Forks: 0
编辑整理: Heisenberg 更新日期:2024 年 12 月 30 日