Automating Research: Building 3dvision-paper-code-daily with GitHub Actions
Heisenberg
2024 年 12 月 30 日
🎓 Automatically Update Some Fields Papers Daily using Github Actions (Update Every 12th hours)
Built by wanghaisheng | Last updated: 20241230
1 minute 42 seconds read
Project Genesis
Exploring the World of 3D Vision: A Journey Through Code and Creativity
As I sat in front of my computer, surrounded by a sea of research papers and code snippets, I felt a spark of inspiration that would ignite my passion for 3D vision. The field of computer vision has always fascinated me, with its ability to transform the way we perceive and interact with the world around us. But it was the recent advancements in 3D vision that truly captured my imagination, pushing me to dive deeper into this captivating realm.
My personal motivation stems from a lifelong love for technology and a desire to create meaningful solutions that can enhance our daily lives. I’ve always believed that the intersection of art and science can lead to groundbreaking innovations, and 3D vision is a perfect example of this synergy. However, embarking on this journey was not without its challenges. The complexity of algorithms, the intricacies of data processing, and the sheer volume of information available can be overwhelming. I often found myself questioning whether I could truly contribute to this evolving field.
But with every challenge came an opportunity for growth. I discovered the 3dvision-paper-code-daily project, a treasure trove of resources that not only curates the latest research but also provides access to code implementations. This platform became my guiding light, helping me navigate the complexities of 3D vision. By leveraging the insights and tools available, I was able to develop a clearer understanding of image matching techniques and their applications.
In this blog post, I’ll take you on a journey through my experiences with 3D vision, sharing the inspiration behind the project, the hurdles I faced, and the innovative solutions I discovered along the way. Whether you’re a seasoned researcher or a curious newcomer, I hope to inspire you to explore the fascinating world of 3D vision and contribute to this exciting field. Let’s embark on this adventure together!
From Idea to Implementation
Under the Hood
Lessons from the Trenches
What’s Next?
Project Development Analytics
timeline gant
Commit timelinegant
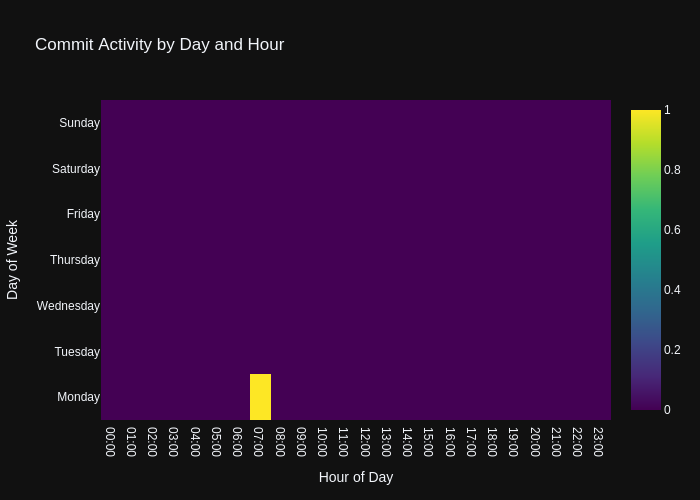
Commit Activity Heatmap
This heatmap shows the distribution of commits over the past year:
Commit Heatmap
Contributor Network
This network diagram shows how different contributors interact:

Contributor Network
Commit Activity Patterns
This chart shows when commits typically happen:
Commit Activity
Code Frequency
This chart shows the frequency of code changes over time:
Code Frequency
- Repository URL: https://github.com/wanghaisheng/3dvision-paper-code-daily
- Stars: 4
- Forks: 1
编辑整理: Heisenberg 更新日期:2024 年 12 月 30 日